The billion dollar warning: P2P’s lessons for the B2B cross-border market

Banks still control most B2B payments – but for how long?
 minute read

Executive summary

The cross-border payment landscape is undergoing a rapid transformation. In recent years, fintechs and neobanks have rapidly gained ground in the person-to-person (P2P) space by delivering faster, cheaper and more intuitive services. Banks, once dominant in this segment, have seen their share erode in a market now worth over $905 billion and growing.
 
The question we’re asking now is: will history repeat itself in the B2B market? 

The opportunity in B2B cross-border payments is even greater, but so are the stakes. Banks currently hold a strong position, supported by trust, regulatory credibility and client relationships. Yet, these advantages are under pressure as businesses increasingly demand more: real-time settlement, price transparency, digital integration and flexibility.

Fintechs are already making inroads with SMBs and have their eyes on large corporates. To maintain leadership, banks must act decisively – not with one-size-fits-all approaches, but with tailored solutions that meet evolving client needs.

This white paper explores where the market is heading, what lessons can be learned from the P2P space, how expectations are shifting and what actions banks must take to defend and grow their role in cross-border business payments.
With increases in global mobility, person‑to‑person (P2P) cross‑border transactions continue to expand, creating a sustained and growing revenue opportunity for financial institutions.
$ 905 B Transacted volume among individuals in different geographies in 2024¹

8.47 % Growth in the past 3 years²

1 B People worldwide who send or receive remittances³

This isn’t a passing trend. More than half of remittance users globally expect to send more or the same amount of money overseas in 2025.⁴ Fintechs have already secured a strong foothold in this space. For banks, this represents a critical moment: the opportunity is significant. They also face the risk of losing cross-border revenue and wider income streams, as fintechs expand into traditional banking services and capture a greater share of business.

People have become global citizens, driving growth in cross-border payments

The growth of cross-border transactions is being driven by a sustained rise in people studying overseas, greater work mobility and ease of international travel. More people now live, work and travel abroad, increasingly sending and receiving money for living costs, education or family support. As of 2024, almost 4% of the world’s population (nearly 250 million people) are living abroad; a 10% increase over the past four years.⁵

High cross-border P2P flows put significant revenue streams within reach

Remittance fees generate substantial revenue, making them a significant and established source of income for financial institutions.

$ 50.8 B Remittance fees currently earned by financial institutions⁶

The cost of sending remittances varies by corridor, currency and transaction value, but the G20 has a target to reduce costs to 3% by 2030. Meeting this target could mean reduced revenue for banks.

In parallel, if banks continue to lose customers to fintechs, it won’t just mean reduced revenues from remittance fees. Associated revenue streams, such as foreign exchange (FX) margins and account fees could also be at risk.

6.3 % Global average for sending $200³

3.5 % SmaRT average⁷

3 % The G20 target for reduced cost by 2030⁷

Europe is a major market for remittance payments with further strong growth expected. 
$ 234 B In 2024, $234 billion originated from European countries, accounting for over a quarter (27.6%) of global remittances.²

94 M With Europe’s migrant population reaching 94 million, a 13% increase since 2020, the demand for cross-border payment solutions is set to climb even higher.⁵

Flows from five countries represent more than half of European remittances

Germany, the UK, France, Spain and Italy send more than $20 billion each in remittances annually. Banks can maximize impact and returns with targeted investment focused on these five countries.²

Geopolitical crises affect remittances and therefore potential revenue

Geopolitical conflicts and economic crises don’t just move people, they move billions. The smartest corridor strategies anticipate where urgent demand for remittance flows will surge next.⁸
Customer expectations are rising, highlighting six key areas that drive their choice of P2P cross-border payment solutions in European markets.

A simple bar chart showing the core needs of P2P customers in Austria and Germany ranked by percentage of respondents who agree that each category or need is important to them, taken from an INNOFACT Cross-Border Payment Transaction Survey. The categories and data for the survey responses is as follows: Security and privacy 93%; Ease of use/ convenience 92%; No fees 90%; Easy-to-understand policies 90%; Easy to sign-in/ onboarding 88%; Transparent fees and timing 88%; Good interface and experience 85%; Reliable customer support 82%; (Near) real-time settlements 77%; Saved bank details/ contact information 73%. Source: Final_INNOFACT_Tables_Payment_transaction_survey_Austria_P2P, VCA_Cross-border Money Movement_Study_v1.0

Source: Confidential consumer survey. Visa Consulting & Analytics, Jan. 2024 – May 2025. Unpublished data.

Banks that don’t recognise and address customer pain points risk pushing customers towards fintech providers that offer a relevant, up-to-date service.

5 pain points driving customers away from traditional banks to fintechs

Banks are losing the remittances race as fintechs gain dominance in the market

Fintechs are gaining ground. Banks will find it a challenge to catch up to fintechs’ pace or mitigate further market share loss.⁹

40 % Transfers to neobanks and remittance specialists in Europe have risen by over 40% in the past three years.¹

50 % The best remittance specialists are seeing significant growth, with transaction amounts soaring by 50% and transacted volumes increasing up to 12.7% annually.

25 % Today, banks facilitate only over a quarter of international money transfers between consumers.¹⁰

Customers’ loyalty to banks is no longer guaranteed

Many customers have historically stayed with banks out of trust, familiarity or lack of awareness over new alternatives, despite pain points like high fees and slow transfers. But that loyalty is eroding. Fintechs are now more visible and accessible, engaging customers through intuitive digital platforms and replacing the personal bank relationship with seamless digital experiences. Banks are at risk of losing customers, not just for cross-border payments but for other revenue streams of their core banking business, such as investments and loans.

Fintechs are redefining market expectations 

Traditional banks that fail to innovate risk becoming irrelevant, losing their place not only in payments but also the rapidly evolving payments ecosystem.

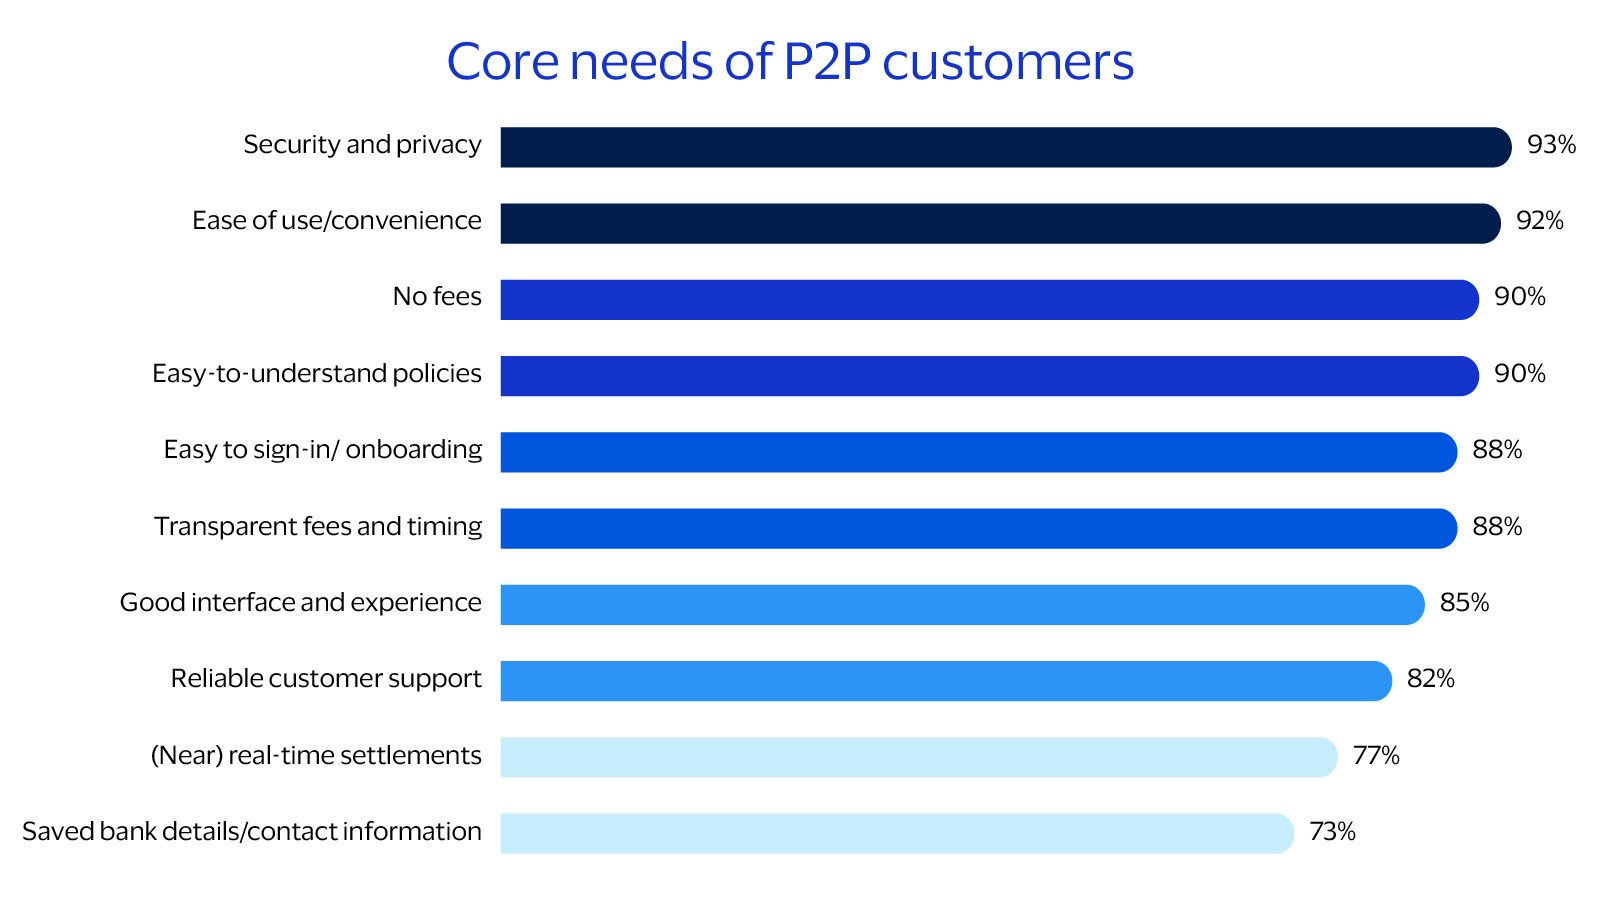
Raising the bar for customer experience

These digital-first providers are setting new industry standards by offering faster, simpler and more transparent services.

Faster P2P payments set new standards

Fintechs are leveraging real-time infrastructure, such as SEPA Instant and Faster Payments, and forming network partnerships, which are making near-instant transfers the new baseline for customers.

24/7 multi-channel customer support

Fintechs are outperforming traditional banks by offering 24/7 assistance through in-app chat, responsive email teams and call centres, ensuring that help is available whenever and however customers need it.

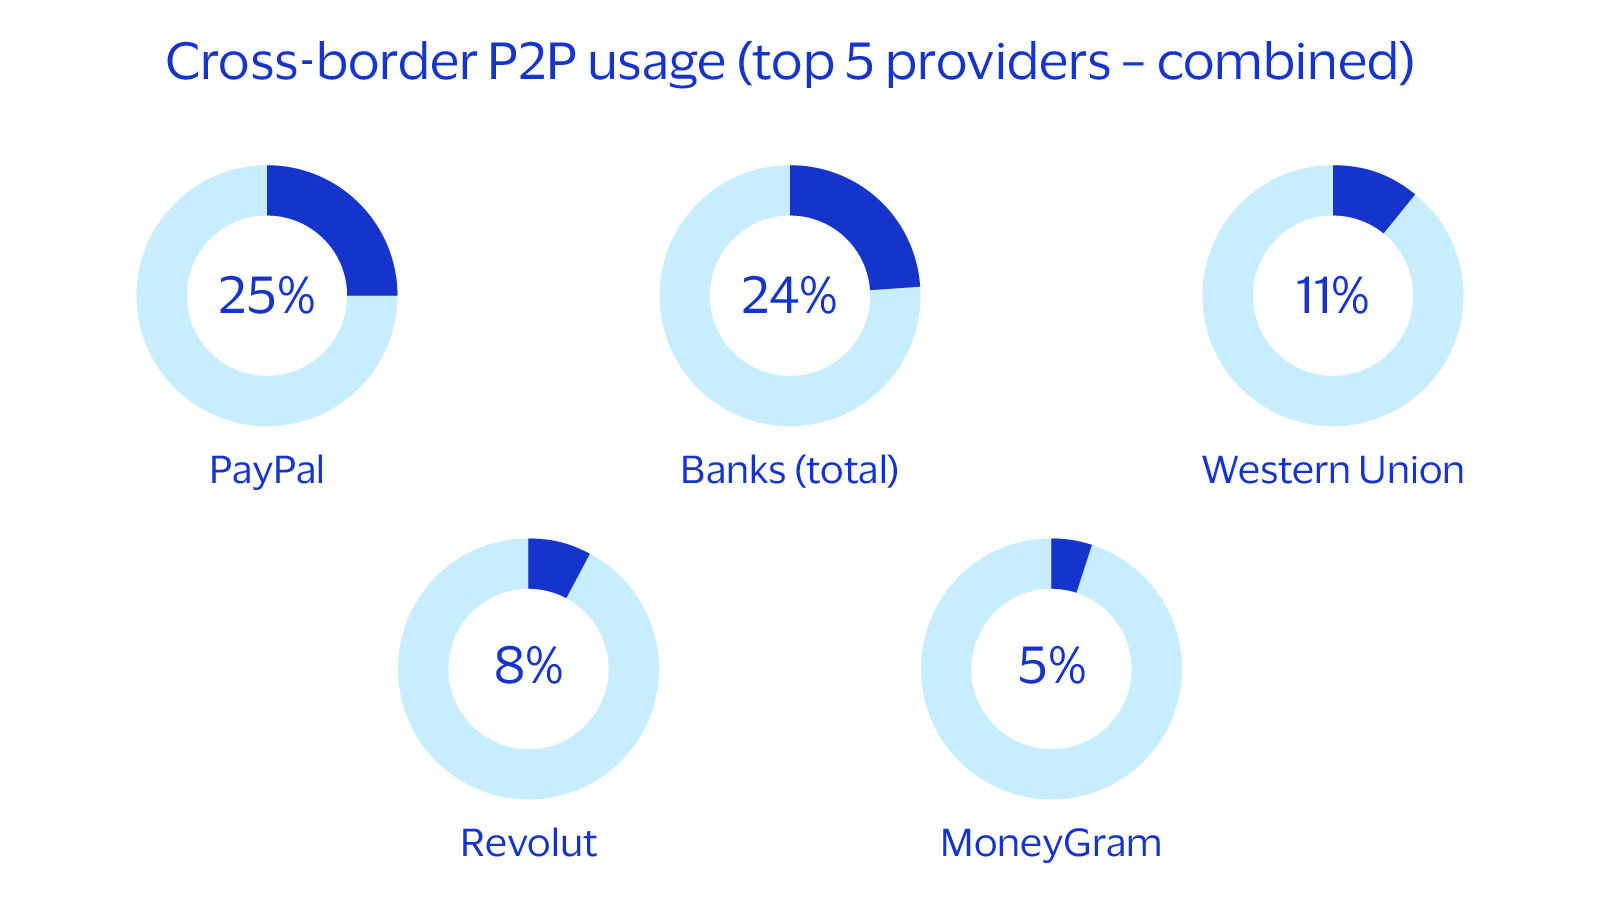
Fintechs are now rivalling or surpassing banks in P2P cross-border usage

They are focusing on building trust through clear pricing, user reviews and digital-first branding. This strategy is working, with PayPal now the top cross-border P2P payment tool by usage (25%), ahead of banks (24%, split between 16% online banking and 8% mobile banking apps). Western Union (11%), Revolut (8%) and MoneyGram (5%) are also in the top five. The fact that Fintechs are outpacing or rivalling traditional banks in customer preference is a clear signal of shifting market dynamics.

A simple pie-chart style diagram showing the preferred payment method for cross-border payments in SEPA nations, using data from GlobalData’s P2P Payments Analytics, 2022. The five individual pie charts contain the following data: PayPal 25%; Banks (total) 24%; Western Union 11%; Revolut 8%; MoneyGram 5%. Source: GlobalData’s P2P Payments Analytics 2022.

Source: Confidential consumer survey. Visa Consulting & Analytics, Jan. 2024 – May 2025. Unpublished data.

The fintech proposition goes beyond payments

Many fintechs are evolving into full-service financial hubs, offering features like budgeting tools, payee management, expense tracking, multi-currency support, local payout options and card issuance. They are also expanding into services such as savings, investments and lending, with the aim of becoming top-of-wallet for customers.
 
With high adoption, strong customer fit and growing loyalty, fintechs are cementing their position. For banks, regaining lost ground will be challenging and require more than closing product gaps. 

Structural advantages still favour traditional banks

Banks hold several structural advantages that make them the default choice for B2B cross-border transactions. They provide security for business operations, mitigating credit risk through trade finance and letters of credit. They also have the scale to advance significant capital when liquidity is tight to keep businesses running smoothly.

First choice due to established trust and security

Banks are still first choice for businesses due to their significant trust and security advantage over fintechs – a position that banks must leverage and maintain. Longstanding regulatory oversight, capital strength and proven risk controls give banks a credibility edge for handling high-value and volume cross-border flows, an advantage fintechs have yet to match.

Expectations are changing and pain points persist

Although businesses see banks as the default choice, it’s not a satisfactory one. Across European markets, including central Europe, the Nordics and CEE, businesses expect faster, cheaper and more user-friendly cross-border payment services. They consistently report that traditional banking services don’t meet their needs and believe cross-border payments should be far more efficient.

Footnote: Central European markets include the Netherlands, Germany, Austria and Switzerland. CEE includes Romania, Poland and Czech Republic.

B2B cross-border payments not only show high volumes but represent a major revenue opportunity for financial institutions in Europe.
$ 7.6 T As a region, Europe’s cross-border outbound volumes constitute $7.6t.¹¹

40 % Europe has the most outbound volumes per country: almost 40% of global outbound volumes per country.¹¹

22 % Germany, France, the UK, Netherlands and Italy are among the top 10 countries with largest outbound cross-border B2B volumes, accounting for 22% of volumes in transactions of this type.¹¹

Banks are still dominant but challengers are gaining traction

The majority of transactions in cross-border B2B volumes are still initiated through banks and traditional payment rails, with banks currently handling 73%.¹² However, businesses are increasingly blending bank services with fintech platforms, using banks for core infrastructure and security, while turning to fintechs for speed, digital interfaces or specific corridor coverage. This hybrid approach reflects growing expectations for flexibility and performance across the entire payments experience.

Footnote: B2B cross-border volumes encompass payments to suppliers abroad (goods and services imports) and purchases with business and corporate cards in foreign countries.

A simple bar chart diagram showing the paint points of small and medium businesses, ranked by percentage of respondents who agree that each category or paint point is a business challenge, based on data from Visa Analysis. The data points shown are: High transaction costs 53%; Transparency of costs and speed 48%; Security concerns 46%; Risk of fraud and cyberattacks 46%; High intermediary fees 45%; Complex reconciliation 43%; Slow speed of transactions 42%; Liquidity challenges 42%; Transparency of tracking payment process 42%; Unpredictable exchange rates 41%. Source: Confidential consumer survey. Visa Consulting & Analytics, Jan. 2024 – May 2025. Unpublished data.

Source: Confidential consumer survey. Visa Consulting & Analytics, Jan. 2024 – May 2025. Unpublished data.

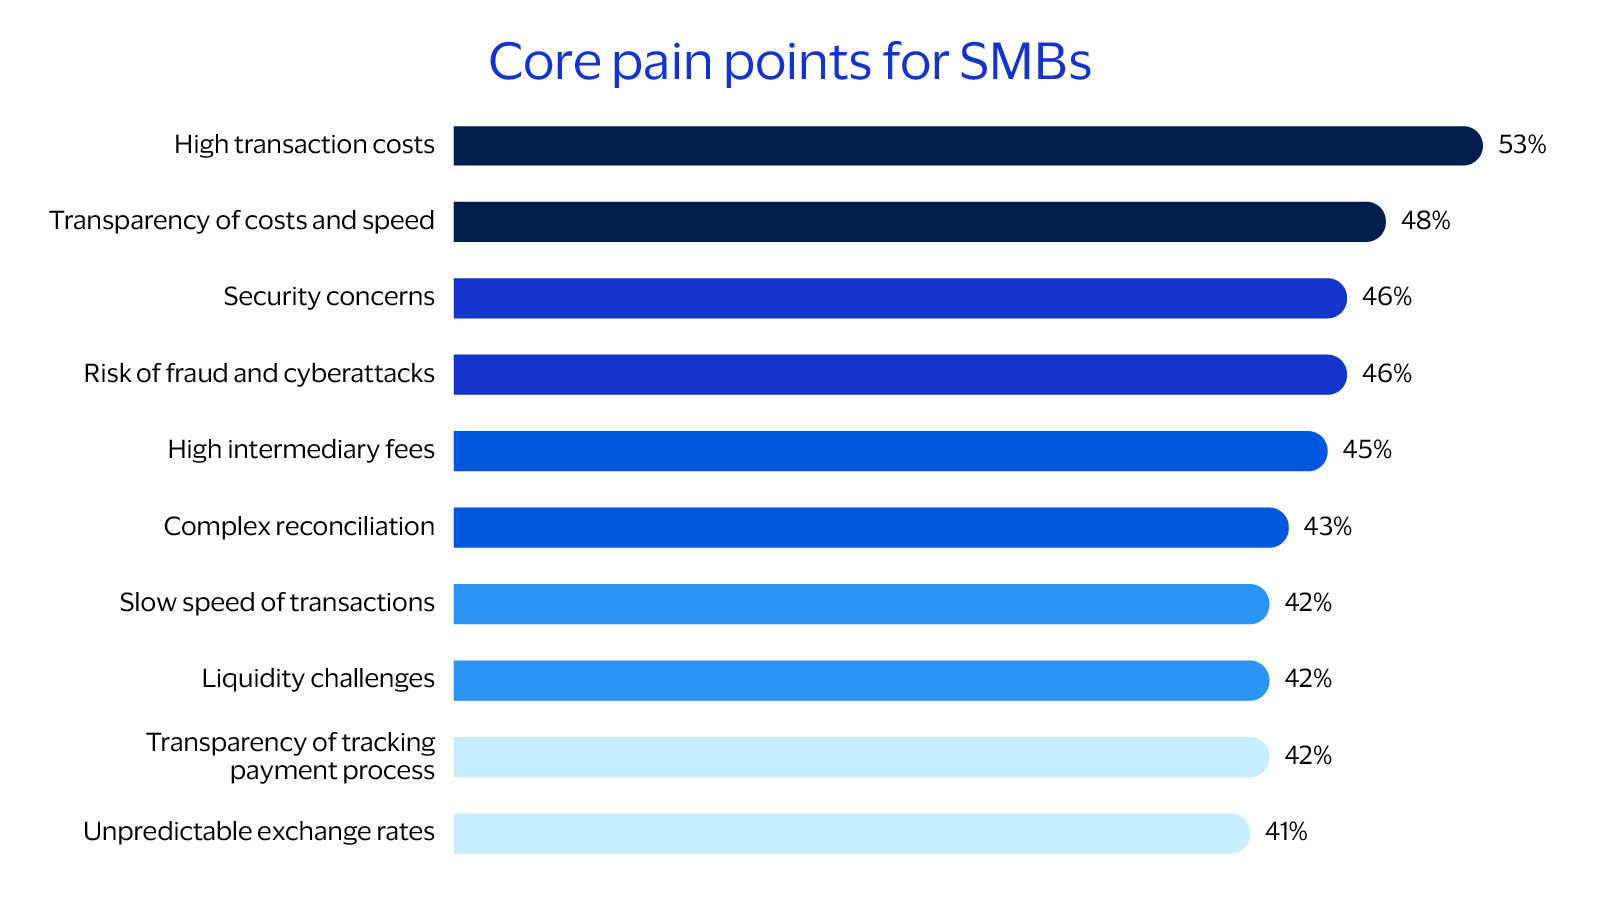
Three key challenges for European SMBs

SMBs expect affordable, transparent, user-friendly solutions

Cost remains the most significant barrier to cross-border payments for SMBs in Europe. More than half cite high transaction fees and unpredictable FX rates as critical challenges. Smaller firms often lack the volume to negotiate better rates. These costs put pressure on already slim margins, discouraging many SMBs from expanding internationally or fully participating in global trade.

Lack of transparency in pricing and timing undermines trust

For SMBs, not knowing the full cost or timing of a cross-border payment remains a major source of frustration. Many face uncertainty around fees, FX rates and settlement times, making it difficult to forecast expenses or manage cash flow effectively. This lack of clarity weakens confidence in providers and can prompt businesses to seek more predictable, transparent alternatives.

Security concerns shape provider selection

Security remains a major concern for SMBs, with nearly half citing fraud and cyber risks as key worries in cross-border payments. Without dedicated treasury or fraud prevention teams, many smaller firms feel particularly exposed, making security a critical factor in how they choose their providers.

Source: Confidential consumer survey. Visa Consulting & Analytics, Jan. 2024 – May 2025. Unpublished data.

The rise in SMB-initiated cross-border transactions across Europe is driving greater demand for efficient payment solutions for this group

More than 95%¹³ of importing businesses in Europe are SMBs, underscoring the scale of demand for efficient, cost-effective cross-border payments to support international trade.

Between 2021 and 2023, the number of European importing SMBs grew by 8%, while their import volumes rose by 12%. This upward trend highlights the increasing need for cross-border payment solutions that meet the evolving demands of this growing segment.¹³

International outbound trade by SMBs experienced a CAGR of 5% from 2019-2023¹⁴, with goods imported by SMBs reaching a cross-border transaction volume of €2.3B in 2023.¹³ This sustained growth highlights a clear opportunity to support this sector. 

Payment volumes highlight priority markets

The largest five countries in Europe make up half of the outbound payment volumes resulting from imported goods and services. This is a significant strategic revenue stream, underlining the importance of addressing SMB pain points in these markets.
55 % The Netherlands, Germany, Italy, France and Spain send 55% of SMBs outbound volumes.

35 % The same five countries lead in transaction volumes of this kind, sending around 35% to other European countries.¹³

Footnote: Small and medium businesses (SMBs) encompass micro, small and medium-sized businesses with fewer than 250 employees.

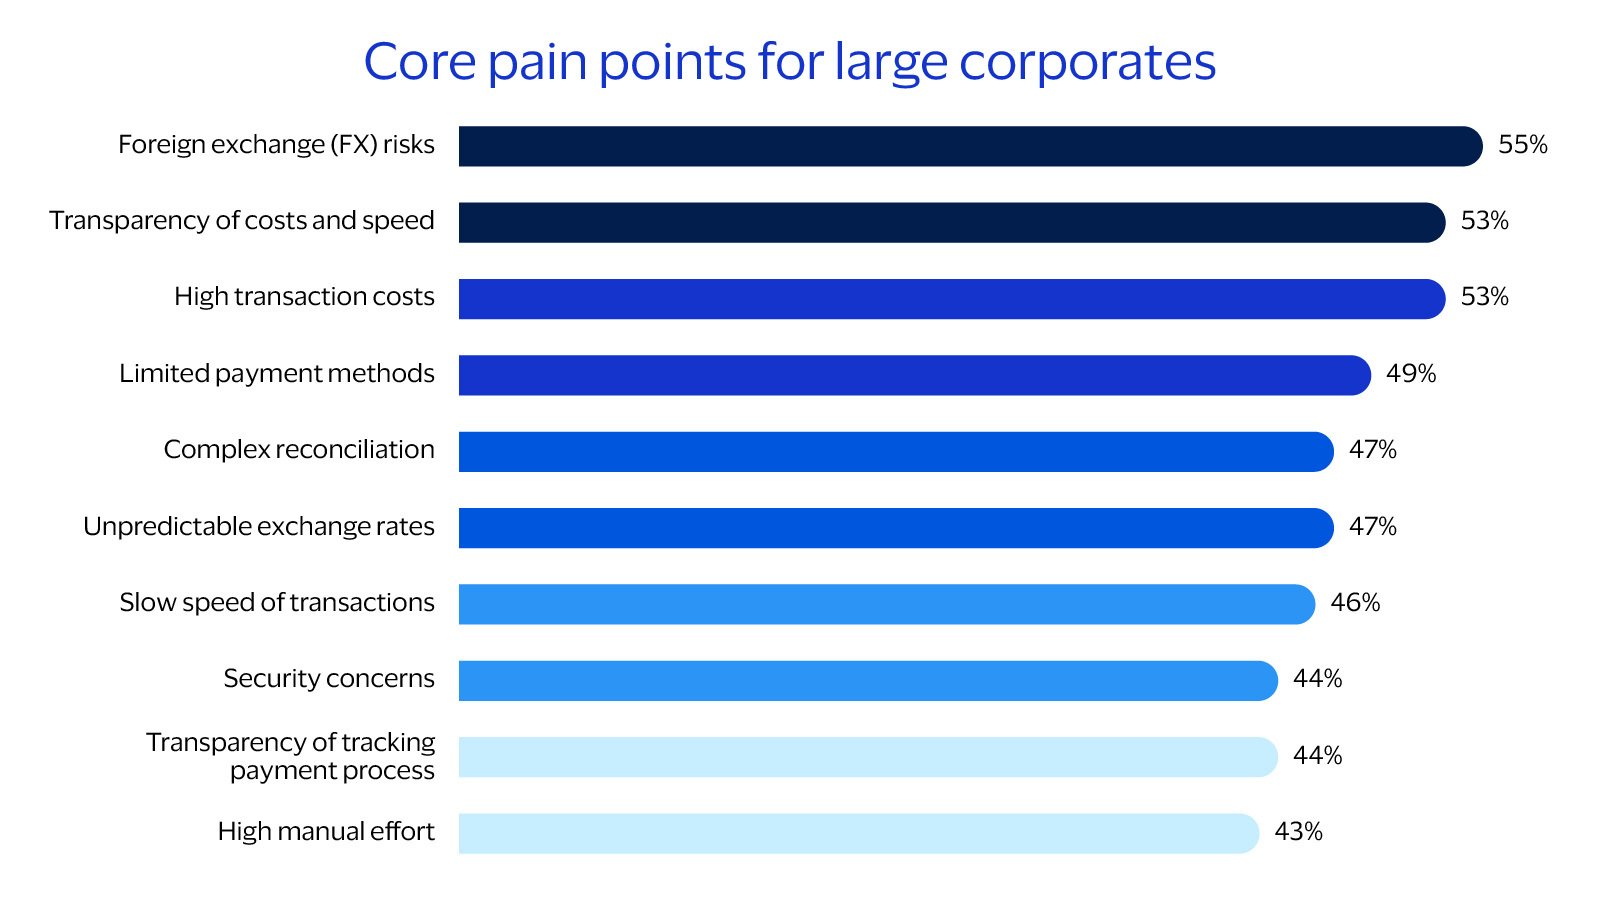
Distinct pain points demand tailored solutions

SMBs and large corporates have distinct needs, priorities and pain points, and solving them requires tailored, type-specific solutions. While banks have a foundation as trusted, secure partners with longstanding relationships, they can no longer rely on historical advantages alone.
 

Banks must act to maintain leadership

Fintechs are already delivering innovative, tailored solutions for SMBs. A one-size-fits-all model is no longer sufficient. To protect their position and compete effectively, banks need to recognise that SMBs and large corporates have different needs and respond with differentiated strategies that reflect the complexity and priorities of each segment.
30 % International trade providers for SMBs are mostly banks, but they are losing share to cross-border specialists who host almost 30% of these transactions.¹⁴

Fintechs will soon move from SMBs to large corporates 

Fintechs are gaining ground in the SMB segment by offering affordable, user-friendly and digitally integrated cross-border payment solutions that directly address current business pain points. Many micro and small firms now expect the same simplicity in business banking that they experience in their personal finances – a demand fintechs are already meeting to capture this segment.

While their current focus remains on SMBs, fintechs are steadily building the capabilities to serve larger, more complex businesses. Their agility and customer-centric approach are reshaping expectations across the market, increasing the urgency for banks to respond with improved, segment-specific solutions.
Fintechs have been able to seize the initiative in the P2P space, attracting significant market share. They are looking to repeat this success in B2B which has a much bigger revenue opportunity. Banks need a strategy that capitalises on shifting market dynamics.

Source: Confidential consumer survey. Visa Consulting & Analytics, Jan. 2024 – May 2025. Unpublished data.

Modern platforms like Visa Direct enable banks to upgrade their cross-border payment services quickly and effectively. From real-time settlement to automation, transparency and security, Visa Direct supports scalable growth across both SMB and corporate segments.

Source: Confidential consumer survey. Visa Consulting & Analytics, Jan. 2024 – May 2025. Unpublished data.

Download a PDF of this white paper

Save the full version of the Visa Money Movement white paper to read on your device any time

Sources

1. Migration Data Portal. (2023). Remittances. Migration Data Portal. https://www.migrationdataportal.org/themes/remittances-overview
2. KNOMAD/World Bank Bilateral Remittance Matrix 2021. (December 2022). 2024 payment volumes are estimated using a 8.47% growth from 2021 to 2024. Growth rate has been retrieved from Dilip Ratha, Sonia Plaza, Eung Ju Kim, Vandana Chandra, Nyasha Kurasha, and Baran Pradhan. 2023. Migration and Development Brief 38: Remittances Remain Resilient But Are Slowing. KNOMAD–World Bank, Washington, DC.
3. World Bank. (2024, June 26). Remittances Slowed in 2023, Expected to Grow Faster in 2024. World Bank. https://www.worldbank.org/en/news/press-release/2024/06/26/remittances-slowed-in-2023-expected-to-grow-faster-in-2024
4. Visa. (2025). Money Travels: 2025 Digital Remittances Adoption Report. Visa.
5. United Nations Department of Economic and Social Affairs, Population Division. (2024). International Migrant Stock 2024. United Nations Department of Economic and Social Affairs.
6. Worldbank, “Remittances slowed in 2023, Expected to grow faster in 2024”, June 2024
7. Financial Stability Board. (2023, October 9). Annual Progress Report on Meeting the Targets for Cross-Border Payments: 2023 Report on Key Performance Indicators. Fsb.org. https://www.fsb.org/2023/10/annual-progress-report-on-meeting-the-targets-for-cross-border-payments-2023-report-on-key-performance-indicators/
8. World Bank Blogs. (2022). Russia-Ukraine Conflict: Implications for Remittance flows to Ukraine and Central Asia. (n.d.). World Bank Blogs. https://blogs.worldbank.org/en/peoplemove/russia-ukraine-conflict-implications-remittance-flows-ukraine-and-central-asia
9. Visa Data. (June 2025). List of remittance services providers accounted for in "P2P - Trx to top players" and "P2P - Country trx to remitters". Visa.
10. GlobalData. (September 2024). Key Trends in Cross-Border Payments, 2024. GlobalData UK Ltd. https://www.globaldata.com/store/report/cross-border-payments-market-analysis/
11. CMS 2023 Market Sizing is based on a combination of data from the 2022 McKinsey Global Payments Map and 2022 EY Visa Direct Global Market Sizing Study (latter based on 2021 data). Russia and China domestic markets are excluded from the global market size. McKinsey Global Payments Map includes 47 markets globally, which comprise ~90% of global GDP. EY Visa Direct Global Market Sizing Study includes 59 markets globally and also estimates the rest of AP, CEMEA, EU, and LAC regions for countries not analyzed specifically.
12. Confidential consumer survey. Visa Consulting & Analytics, Jan. 2024 – May 2025. Unpublished data. 
13. Eurostat. (2025). “Trade by NACE Rev. 2 activity and enterprise size class”. Eurostat. https://ec.europa.eu/eurostat/databrowser/view/ext_tec01/default/table?lang=en
14. Visa Consulting & Analytics. (June 2025). Data from German SMB international trade data. Visa.

Disclaimers

The projections and growth estimates contained in this document are based on historical data, current market trends, and a variety of assumptions. These projections are intended for informational purposes only and should not be interpreted as guarantees of future performance. While we strive to provide accurate and realistic forecasts, numerous factors, including but not limited to market volatility, economic changes, and unforeseen circumstances, can influence actual outcomes. Consequently, there is no assurance that the clients will achieve the projected growth levels. We recommend that clients consider these projections as one of many tools in their decision-making process and consult with Visa Consulting and Analytics for personalised advice.
Case studies, comparisons, statistics, research and recommendations are provided “AS IS” and intended for informational purposes only and should not be relied upon for operational, marketing, legal, technical, tax, financial or other advice. Visa Inc. neither makes any warranty or representation as to the completeness or accuracy of the information within this document, nor assumes any liability or responsibility that may result from reliance on such information. The information contained herein is not intended as investment or legal advice, and readers are encouraged to seek the advice of a competent professional where such advice is required. When implementing any new strategy or practice, you should consult with your legal counsel to determine what laws and regulations may apply to your specific circumstances. The actual costs, savings and benefits of any recommendations, programs or “best practices” may vary based upon your specific business needs and program requirements. By their nature, recommendations are not guarantees of future performance or results and are subject to risks, uncertainties and assumptions that are difficult to predict or quantify. All brand names, logos and/or trademarks are the property of their respective owners, are used for identification purposes only, and do not necessarily imply product endorsement or affiliation with Visa.
This presentation contains forward-looking statements within the meaning of the U.S. Private Securities Litigation Reform Act of 1995 that relate to, among other things, [our future operations, prospects, developments, strategies, business growth and financial outlook]. Forward-looking statements generally are identified by words such as “believes,” “estimates,” “expects,” “intends,” “may,” “projects,” “could,” “should,” “will,” “continue” and other similar expressions. All statements other than statements of historical fact could be forward-looking statements, which speak only as of the date they are made, are not guarantees of future performance and are subject to certain risks, uncertainties and other factors, many of which are beyond our control and are difficult to predict. We describe risks and uncertainties that could cause actual results to differ materially from those expressed in, or implied by, any of these forward-looking statements in our filings with the SEC. Except as required by law, we do not intend to update or revise any forward-looking statements as a result of new information, future events or otherwise.